



From a Red Cell to a Defensible Answer
The order the work actually happens in, on real data.
A percentage gap is not a finding. A significance level is
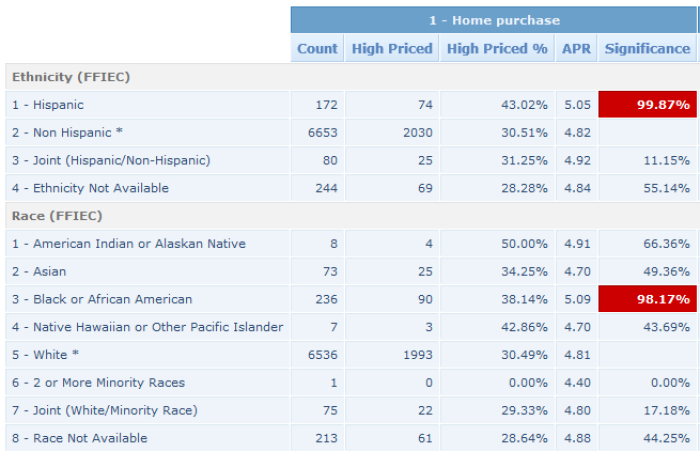
Any two groups will differ. The question a regulator asks is whether the difference is larger than chance explains, and that is a calculation — not a judgement call about whether 43% versus 30% looks like a lot. Computing it per row, per product, turns a wall of percentages into a short list of things to actually investigate. If you would rather work through the order of that review yourself first, we set out how to run a fair lending self-assessment step by step.
- Significance per row so the 99.87% cell separates itself from the 11.15% one.
- FFIEC ethnicity and race categories as the agencies define them, including the not-available rows.
- Segmented by product because a disparity in home purchase is a different conversation from one in refinancing.
The applications behind the number, without rebuilding a filter
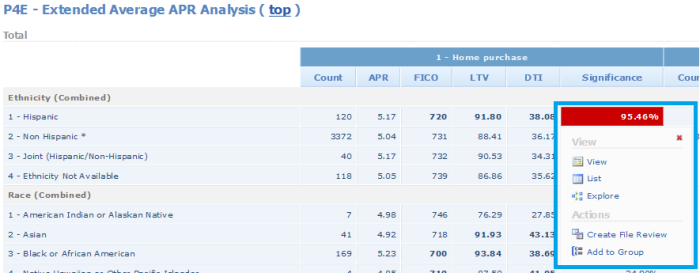
This is the step that decides whether a fair lending programme is sustainable. If getting from “this cell is flagged” to “here are the 120 applications” means exporting and re-filtering, it happens once a year under duress. If it is a right-click, it happens whenever somebody is curious.
- FICO, LTV and DTI alongside APR so the obvious credit explanations are visible immediately.
- Create File Review from the cell the comparative review is scoped by the finding, not rebuilt around it.
- Add to Group to keep a population under observation across future cycles.
Regression an examiner recognises, not a black box
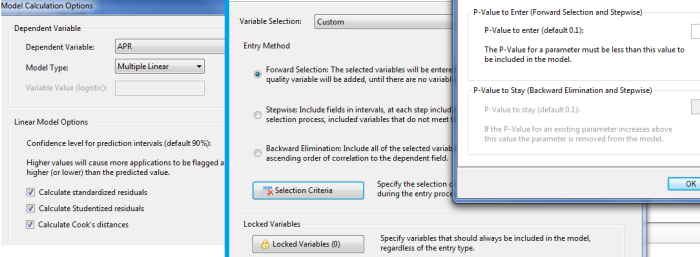
A model is only useful in an examination if its specification can be shown and defended. Forward selection, stepwise and backward elimination with explicit p-value thresholds, locked variables you insist on keeping, and standardized residuals and Cook’s distances calculated as standard — these are the terms the conversation is conducted in.
- Logistic for underwriting, linear for pricing with values transformed and dummy-coded rather than hand-built.
- Standardized and studentized residuals, Cook’s distances so influential applications are identifiable.
- Locked variables for the controls you will always include regardless of the entry method.
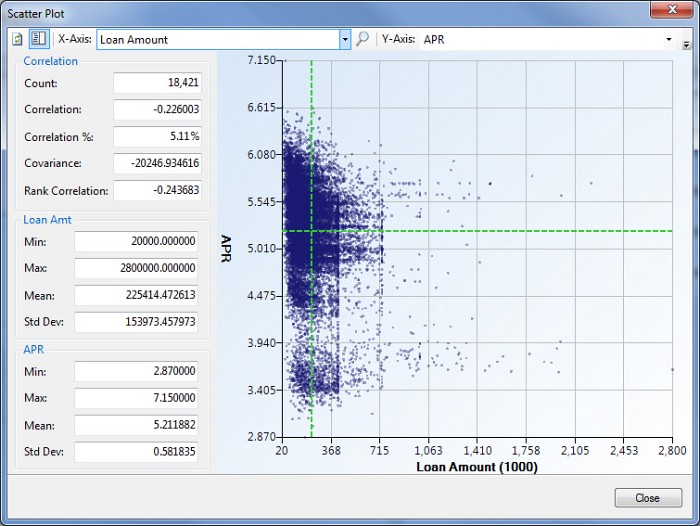
The point sitting on its own is the one you will be asked about
Residual tables tell you an application is an outlier. A plot tells you what kind — a genuine exception, a data error, or a cluster with something in common. Plotting any field against any other, with correlation and dispersion computed alongside, is how you tell those apart before somebody else does.
- Any field on either axis APR against amount, FICO, LTV or anything else on the record.
- Correlation, covariance and rank correlation next to the picture, not in a separate report.
- Mean crosshairs and per-axis dispersion so “far out” has a scale attached to it.
- 39years, since 1987
- Hundredsof institutions filing
- 1 in 5applications have no reported race
- BISGThe proxy the CFPB uses fills the gap
Fair Lending Features
Last updated: September 29, 2026
A feature list says what the software has; the output is what an examiner actually reads. To see a scorecard and a regression summary rendered against a real portfolio, walk through the fair lending analysis in a live demo.
Scorecards across all 12 FFIEC risk factors
Click any cell to drill straight into application-level data, no rebuilding filters. Add fields, comparisons and conditional formatting, or start from an examiner-tested template. Screenshot.
Regression built the way examiners run it
Logistic regression for underwriting, linear for pricing, with field values transformed and dummy-coded automatically rather than by hand, and consistency-verification tools to catch relationships between variables before they distort a model. Screenshot. See what a regression model can and cannot prove before you rely on one.
Sampling methods the agencies defined, not ones we invented
Which files you review is itself an examination question, and “we picked fifty” is not an answer to it. Five sampling methods are built in and three are the agencies’ own: CFPB/FRB review sampling in streamline or full form, and OCC numerical sampling where you set the reliability level — 80%, 86%, 90% or 95% — and a precision level, and the sample size is then calculated rather than guessed. An evaluation worksheet can be generated alongside the sample. Count and percent sampling are there for when a fixed number or share is what you actually want. Screenshot.
Residuals are data, not just output
Every application-level regression result is filterable, sortable and usable in a scorecard — set a rule to automatically group every application with a standardized residual past ±3, and go straight to the ones worth a second look. Screenshot.
BISG proxy for non-reporting borrowers
In the 2024 HMDA data, 18.3% of applications nationwide carry no reported race and 17.0% no reported ethnicity — and the share is consistently higher on denials than on originations, which is precisely where a fair lending review looks. BISG estimates the missing values from surname and geography, using the same methodology regulators apply, so the analysis covers the whole file instead of dropping a fifth of it. Screenshot. BISG estimates a probability, not a label — see where the method is known to fail.
Matched-pair analysis, inside comparative file review
Build a matched-pair pool on whatever partitioning and matching criteria you choose — the same technique examiners use to put a denied applicant beside a similarly-situated approved one. Comply selects the pairs, then puts the files side by side and documents the review at pair, application and individual-field level. Some vendors sell this as “match pair testing” and some as “comparative file review”; in Comply the first is how the second gets built. What the FFIEC procedures actually call each step, if the two names have you double-checking a vendor’s claim.
Redlining risk: geography, peers and penetration
Redlining is a geographic argument, so it is tested geographically: majority-minority tract penetration, lending inside versus outside the assessment area, market share against the peers an examiner would pick, and branch and ATM placement against demographics. Comply scores it as one of the twelve FFIEC risk factors and maps it alongside the applications behind the number. The whole review is set out on redlining analysis.
Workspaces bring it together
Application groups, Data Mines, file reviews and regression models sit on one dashboard, organized at whatever granularity you choose, with reports and interactive charts a click away. Screenshot.
Field Explorer
Browse application data at a summary level, drill to a focal point, then create a Data Mine, file review, application group or regression model directly from what's selected. Doubles as a general exploratory statistics tool. Screenshot.
Filter, sort and sample
Filters built on the fly, saved and reloaded against any application set. Save a filtered or hand-picked selection as an application group and reuse it as the source for any analysis, automated or interactive.
Analyze results, then act on them
Turn a regression model into a scorecard identifying pricing disparities, and compare reports across time periods, assessment areas, underwriters or brokers — not just one snapshot in isolation. Screenshot.
Integrate with any external package
Export data, run an external command and reimport the result with one click. Those fields then behave like any other Comply field, including inside scorecards and file reviews. Screenshot.
Design once, reuse everywhere
Every view and process saves as a reusable "Definition" — scorecards, regression models, file reviews and imports included — and Auto-Pilot runs any of them on a schedule, offline or on.
Run any process on your terms
Edit checks, geocoding and field updates run individually or in batch, rather than one undifferentiated "update" that touches everything whether you asked it to or not.
Integrated compliance-grade geocoding
Batch the whole dataset or geocode a single application, plus the ZOOM interactive geocoder for checking results against a map across multiple data sources. Screenshot.
One relational database, enterprise security
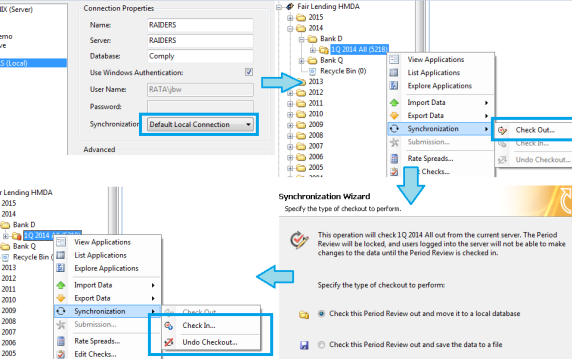
A single SQL Server database and a .NET client, not a separate siloed database per dataset. User- and group-level security, Windows or SQL authentication throughout, and offline work by period-review check-out and check-in — checking a period out locks it on the server, so nobody edits it behind you while you work off-network. Screenshot.
Unlimited custom fields, tab-based multitasking
Any data type, usable anywhere — a filter, a regression variable, a scorecard statistic — shown or hidden per dataset. Keep several datasets, reports or analyses open in tabs, each with its own history.
And the rest
Import-time filtering of any fixed-length or delimited file, five sampling methods, three of them regulator-defined (CFPB/FRB streamline, CFPB/FRB full, and OCC numerical sampling with selectable reliability and precision levels), official LAR/MicroData file creation with encryption, AutoUpdates for system data, HMDA/CRA disclosure and performance tables, and a built-in mapping component.
Fair Lending Resources
The regulatory guidance and research behind Comply Fair Lending’s methodology — examination procedures, statistical papers, and agency guides, in the agencies’ own words.
Interagency Fair Lending Examination Procedures
This overview provides a basic and abbreviated discussion of federal fair lending laws and regulations. Adapted from the Interagency Policy Statement on Fair Lending issued in March 1994.
Read the proceduresComptroller’s Handbook — Fair Lending
Examiners use these procedures to evaluate a national bank’s compliance with the Fair Housing Act, ECOA, and Regulation B. Includes the FFIEC’s Interagency Fair Lending Examination Procedures plus OCC supplemental material.
Read the handbookData Limitations and Fragmented Federal Oversight
GAO analyzed fair lending laws and relevant research, interviewed agency officials, lenders and consumer groups, and reviewed 152 depository institution fair lending examination files.
Read the reportAnatomy of a Fair-Lending Exam
The role of statistical analysis in fair-lending compliance examinations, with a case study of an actual exam of a large mortgage lender showing how statistics can uncover discrimination or exonerate an institution.
Read the paperHow Low Can You Go? Optimal Sampling for Exams
Researchers face a tradeoff between the lower cost of smaller samples and the higher confidence of larger ones. This paper covers sampling strategies that reduce cost while holding confidence levels.
Read the paperCRA and Fair Lending Regulations: Trends in Mortgage Lending
The evolution of fair lending regulations and the CRA, with a summary of the economic literature covering both.
Read the article Banker’s guide to risk-based examsSide by Side: A Guide to Fair Lending
Ways an institution can discover uneven customer service or inconsistent lending practices. Not about proving discrimination — about comparing applicant treatment and correcting problems before an exam finds them.
Read the guideHow Does Comply’s Regression Analysis Explain a Pricing Disparity to an Examiner?
By making the specification visible. A disparity is only an argument if you can show which legitimate factors were controlled for, how they were entered, and which applications are driving the result. That is the whole job of fair lending regression analysis software, and the four sections below are what Comply does with it.
The model you run is the model an examiner recognises
Logistic regression for underwriting decisions, linear regression for pricing. Field values are transformed and dummy-coded automatically rather than by hand, so a credit score band or an occupancy code enters the model correctly without a spreadsheet step nobody can reproduce later. Consistency-verification tools flag relationships between variables before they distort the fit.
Variable selection is a stated method, not a judgement call
Forward selection, stepwise and backward elimination, each with explicit p-value thresholds to enter and to stay, and variables you can lock into the model regardless of what selection would do with them. That matters in an examination because the question is rarely “what does your model say” and usually “why does it contain what it contains”.
The output points at specific files, not just a coefficient
Standardized and studentized residuals and Cook’s distances are calculated as standard, so the applications with disproportionate influence on the result are identifiable rather than buried in the aggregate. Every application-level result is filterable, sortable and usable in a scorecard — set a rule that groups any application with a standardized residual past ±3 and go straight to the files worth a second look.
Which files you then review is also a defensible choice
Sampling is where a regression result becomes a file review, and “we picked fifty” is not an answer. CFPB/FRB review sampling in streamline or full form and OCC numerical sampling are built in, the latter with a reliability level you set at 80%, 86%, 90% or 95% and a precision level, so the sample size is calculated rather than guessed. See what the FFIEC procedures actually call each step.
And what it cannot do
A model establishes that a disparity survives the controls you supplied. It cannot establish that no omitted legitimate factor explains it — the OCC’s own handbook says “statistical modeling” rather than “regression” and sets a three-part test for when an omitted factor matters. Comply gives you the specification and the influential files; the argument is still yours to make. We set out what regression analysis can and cannot prove, quoting the handbook, because a compliance officer who has been burned by an overconfident model is right to ask.
Who has to run it, and how long it takes
The reason regression gets outsourced is rarely the statistics. It is that the specification, the variable coding and the sampling have to be defensible, and building that from a blank spreadsheet is what turns a quarterly check into a project. Comply carries the method as settings rather than as expertise: the selection procedures and their p-value thresholds, the transformations, the CFPB/FRB and OCC sampling rules with their reliability and precision levels. A compliance officer sets them; nobody needs to be a statistician to defend what they set, because the specification is on screen rather than in someone else's model.
What that changes is the cadence. Every view and process saves as a reusable definition, so the second run is the first run repeated on new data rather than rebuilt, and the interactive scorecards cut analysis from weeks to hours. An institution that has been paying consultants for an annual review can generally run the same analysis quarterly for the cost of a run, and the year the examiner asks for it, the prior years re-run and produce the same numbers.
A model answers the question once it has been asked. What tends to catch institutions out is the document requests an examiner opens with, which arrive well before any regression does.
What Fair Lending Analytics Actually Measure
Analytics on lending data is not one number, and the unit it is measured at decides what the number means. The same portfolio produces different findings depending on whether you are counting applications, census tracts or a whole assessment area, and the first thing an examiner establishes is which one you used.
- At application level. Approval, denial and pricing outcomes for each applicant, set against the legitimate factors that were supposed to explain them. This is the only level at which a difference can be attributed to a decision rather than to a population.
- At census tract level. Where the lending went and where it did not: penetration into majority-minority tracts, measured against the tracts a lender of that size and footprint would be expected to reach.
- At assessment area level. The same question asked of the geography you defined, and then of the geography an examiner might define instead. The distance between those two answers is itself a finding, which is why redlining review treats the assessment area and the reasonably expected market area as separate objects.
A disparity is not yet a finding. A rate that differs between two groups is the start of the question rather than the answer to it. Two things have to happen before it becomes a finding: it has to survive the legitimate factors that could explain it, and it has to be large and consistent enough not to be noise. Output that reports the difference without separating those two gives a compliance officer a number they cannot defend in a room.
That separation is what the FFIEC risk factors are for. Comply scores all twelve of them and lets you open any cell to the applications underneath, so the number and the files behind the number are never in two different systems.
What a Fair Lending Monitoring Program Contains
A monitoring program is not an annual self-assessment performed more often, and the distinction is the one most often blurred. A self-assessment produces a report. A monitoring program produces a decision rule: a threshold agreed before the data is looked at, and a defined thing that happens when a number crosses it.
A quarterly cycle that holds up under examination generally carries four things:
- A refresh on data you already hold. The LAR you are building for the filing is the same data the analysis runs on, so the cycle costs a run rather than a project.
- Thresholds set in advance. Deciding what counts as material after seeing the result is the failure an examiner is looking for. Setting it first is also what makes an uneventful quarter evidence rather than an absence of evidence.
- An escalation path with a name on it. Who is told, how quickly, and what they are expected to do. A threshold with nothing attached to it is a report, not a control.
- A record of what was reviewed and concluded. Including the quarters where nothing crossed. A programme that only generates documents when it finds something cannot show it was running the rest of the year.
The argument for keeping the cadence tight is remediation, not detection. A pattern found in the quarter it appears can be corrected while the affected files are still current; the same pattern found at the annual review is a year of lending to explain.
The order the steps run in is set out in our step-by-step fair lending self-assessment guide, which is the same sequence a monitoring cycle repeats.
Frequently Asked Questions
The seven we are asked most often about Fair Lending analysis, answered properly rather than in a sentence. If yours is not here, it is a better use of your time to ask a person.
Ask us directlyWhat is BISG in Fair Lending analysis?
BISG (Bayesian Improved Surname Geocoding) is a proxy method to estimate borrower race and ethnicity when not self-reported. Comply Fair Lending includes BISG analysis using the same surname and geography data the CFPB uses in its own proxy methodology, to support fair lending reviews and ECOA compliance testing.
What statistical methods does Comply Fair Lending support?
Comply Fair Lending provides logistic regression for underwriting analysis, linear regression for pricing analysis, comparative file review (matched-pair analysis), and risk scorecard generation. All methods follow FFIEC fair lending examination procedures and include built-in validation tools to verify model quality and statistical significance.
How does risk scoring work in Fair Lending analysis?
Risk scorecards aggregate statistical results to identify high-risk areas requiring file review. Comply calculates disparities between control and protected class groups across underwriting decisions, pricing, and terms. Scorecards prioritize areas by statistical significance and practical impact, helping focus limited review resources on applications most likely to reveal fair lending concerns.
Can Comply Fair Lending help prepare for regulatory exams?
Yes, Comply generates exam-ready reports following FFIEC procedures. Run fair lending analysis quarterly or annually to identify and remediate risks before examiners arrive. The software produces documentation examiners expect: regression model summaries, comparative file reviews, scorecard results, and corrective action tracking—demonstrating your proactive fair lending monitoring program.
How does RATA identify Fair Lending issues across FFIEC risk factors?
Risk scorecards cover all 12 FFIEC fair lending risk factors, and clicking any cell drills straight into application-level data with no report to close or filter to rebuild. Use an examiner-tested template or build a custom scorecard for your institution's specific risk areas. Interactive scorecards cut analysis time from weeks to hours, so an anomaly gets investigated immediately instead of waiting on a manual report.
How does RATA normalize data across origination systems?
Comply identifies missing or invalid data and lets you focus on applications with incomplete information or entry errors, then update or remove outlying data from the analysis workspace with automated tools. Scatter plots and other interactive charts help compare fields visually to catch a trend or an integrity issue before it reaches a model.
How does RATA support comparative file reviews for examiners?
Build a matched-pair pool with whatever partitioning and matching criteria you choose, then create a file review from any set of applications or analysis elements. Document each pair at the file-review, application-pair, application and individual-field level, print the pairs that need further attention, and group and annotate the ones where no risk was found — then generate an executive summary or a detailed field-level report from the whole review.
Does Comply do matched-pair analysis (match pair testing)?
Yes, and it is how Comply builds a comparative file review. You set the partitioning and matching criteria, Comply assembles the matched-pair pool, and the paired files are then reviewed side by side and documented at file-review, application-pair, application and individual-field level.
The two names describe two halves of one procedure rather than rival methods: matched-pair analysis is how the files get selected, and comparative file review is the examination of the files it selected. Vendors market one name or the other. Comply does both steps.
Does Comply support redlining analysis?
Yes, through the capabilities a redlining review is made of rather than a separate module: majority-minority census tract penetration, lending inside versus outside the assessment area, peer and market-share comparison, branch and ATM geography against tract demographics, and redlining as a scored factor in the twelve-factor risk scorecard built on FFIEC examination procedures, with mapping to see the pattern and drill through to the applications behind it.
How does Comply choose which loan files to review?
Comply offers five sampling methods and three of them are defined by the agencies rather than by RATA. CFPB/FRB review sampling is available in streamline and full forms. OCC numerical sampling lets you set the reliability level, at 80, 86, 90 or 95 percent, and a precision level, then calculates the sample size for you instead of leaving it to judgement, and it can produce an evaluation worksheet alongside the sample. Count and percent sampling are available when a fixed number or share is what you want. This matters in an examination because the defensibility of a file review depends on how the sample was drawn, and a sample size derived from a stated reliability and precision level is something you can explain.
Comply Fair Lending vs Manual Analysis
See how software-driven analysis reduces risk and saves time
| Analysis Task | With Comply Fair Lending | Manual Analysis |
|---|---|---|
| BISG Proxy Analysis | Automated Bayesian Improved Surname Geocoding with Census Bureau surname list and tract demographics. Complete proxy analysis in minutes. | Manual surname lookup in Census tables, manual geocoding, complex spreadsheet calculations. Hours of work, high error risk. |
| Regression Analysis | Built-in logistic regression models for pricing and credit decisions. Automatic control variable inclusion, statistical significance testing, and results interpretation. | Requires statistical software expertise (SAS, STATA, R). Manual data preparation, model specification errors common, difficult to replicate. |
| Comparative File Review (Matched-Pair) | Automated matched-pair selection based on your criteria. Side-by-side comparison reports with highlighted disparities and risk scoring. | Manual file selection prone to bias. Time-consuming individual file reviews. Difficult to document methodology and ensure consistency. |
| Pricing Analysis | Scatter plots, pricing disparity reports, and statistical tests for prohibited basis pricing differences. Visual identification of outliers and patterns. | Manual Excel charts, limited statistical testing capability. Difficult to control for legitimate pricing factors. Results may not withstand examiner scrutiny. |
| Risk Scoring | 12-factor risk scorecard with weighted assessment. Quantifies fair lending risk across multiple dimensions with actionable remediation priorities. | Subjective risk assessment. Inconsistent evaluation criteria. Difficult to track risk changes over time or justify to examiners. |
| Documentation | Exam-ready reports following FFIEC procedures. Complete audit trail, methodology documentation, and statistical validity evidence. | Manual report creation. Inconsistent documentation. Examiners question methodology. Difficult to demonstrate systematic monitoring. |
| Time to Complete Analysis | Hours for comprehensive fair lending review | Days or weeks for partial analysis |
| Regulatory Updates | Automatic updates to BISG surname list, FFIEC procedures, and regulatory guidance. No additional work required. | Manual research and implementation of methodology changes. Risk of using outdated procedures or data sources. |
What Our Customers Say
Trusted by financial institutions nationwide for compliance excellence
“The support has been exceptional. The program is very easy to use. RATA has been one of the best companies I have dealt with in my 25 years of banking. Their service has exceeded my expectations.”
“I wanted to let you know that RATA and Comply is the absolute best!!! My submission is complete and was accomplished in record time. I more than doubled the amount of activity I reported last year and it took me less than half the time. Thank you for being there for us and the industry! You are and always will be number one to me!!!”
“Would highly recommend both the product and the personnel!! Being able to accomplish what I did in such a short period of time is a testimonial to the product's user friendliness as well as the support I received from the great folks at RATA. Could not have done it without them!!!”


 … and hundreds of others since 1987
Methodology & Sources
The risk factors and regression tests on this page follow FFIEC fair lending examination procedures; the BISG (Bayesian Improved Surname Geocoding) proxy method follows the CFPB's published methodology. See the risk scorecard and regression testing sections above for how each is applied. RATA Associates maintains this page and updates it when FFIEC or CFPB guidance changes.
You may republish the figures and methodology on this page with attribution and a link to rataassociates.com/comply-fair-lending/. To cite it: RATA Associates, “Fair Lending Software: Regression, Matched-Pair & BISG Analysis,” last updated September 29, 2026, https://rataassociates.com/comply-fair-lending/.


